Cases and variables, side by side.
Work with rows and columns in the Data view. Switch to Variables to inspect and edit names, types, labels, and other variable properties.
Get to know the editor → DialogR
R analysis. No programming required.
You choose the analysis. DialogR writes the R command for you. Work through familiar menus and dialogs, select your variables, and run your analysis — no R knowledge needed.
Coming from SPSS? Feel at home with data and variable views, menus, and dialogs.
Select your dataset and variable, then click Run. This is the actual Frequency table dialog.
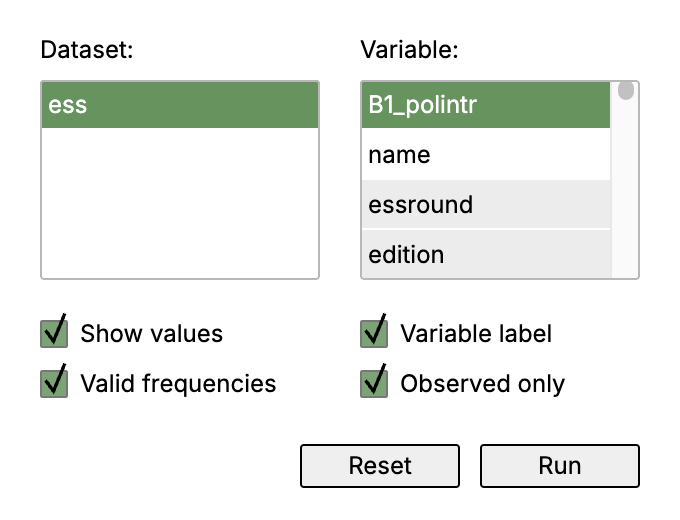
Real data from European Social Survey, Round 9, Romania in the RODA catalogue, with its labels and declared missing values intact.
Follow the illustrated walkthrough →From SPSS to R
If you know your way around SPSS, you already know the idea: browse your data, define your variables, choose a menu, and fill in a dialog. DialogR brings that familiar workflow to R.
Work with rows and columns in the Data view. Switch to Variables to inspect and edit names, types, labels, and other variable properties.
Get to know the editor →Find a procedure in Data, Transform, or Analyze. Select the variables and options you need; DialogR takes care of constructing the command.
Browse the available dialogs →Use DialogR on macOS, Windows, or Linux, or start with WebR in your browser. A responsive interface brings the dialog-driven workflow across these environments.
Choose your version →A clear path from data to insight
Open your SPSS, Stata, SAS, or Excel data. Browse cases in the data view and review their definitions in the variable view.
Meet the import tools →Choose an analysis from the menus, select variables, and set your options. The dialog constructs the R command automatically.
Find your analysis →Run the analysis without writing code. If you want to learn R, the generated command is there to explore, save, and reuse.
Explore the generated commands →Built around real research data
Move into R with data from SPSS, Stata, or SAS. DialogR uses DDIwR for these imports and the declared package for working with labelled data and declared missing values.
Excel works too: use one rectangular data table, one variable per column, and one case per row. The manual explains the layout and optional metadata sheets.
Prepare your first import →A useful starting toolkit
Sort cases, select subsets, recode values, set grouping, and apply frequency weights.
Frequency and contingency tables, numerical summaries, one-sample and independent-samples t-tests, and one-way ANOVA.
Read the guide to every dialog →More than numbers in cells
Multiple missing values. Their meaning preserved. DialogR uses the declared R package to distinguish “refusal”, “don’t know”, and “not applicable” — instead of losing their meaning in a single undifferentiated missing value. Each can keep its own code and label while being treated as missing in supported analyses.
View and edit those definitions in the familiar variable editor. Frequency tables can show the missing categories, while valid percentages and numerical summaries exclude responses declared missing.
In the European Social Survey, Round 9, Romania example from the RODA catalogue, seven refusals remain visible in the political-interest table. They are excluded from its valid percentages — automatically, because their meaning is part of the variable.
See labels and missing values in action →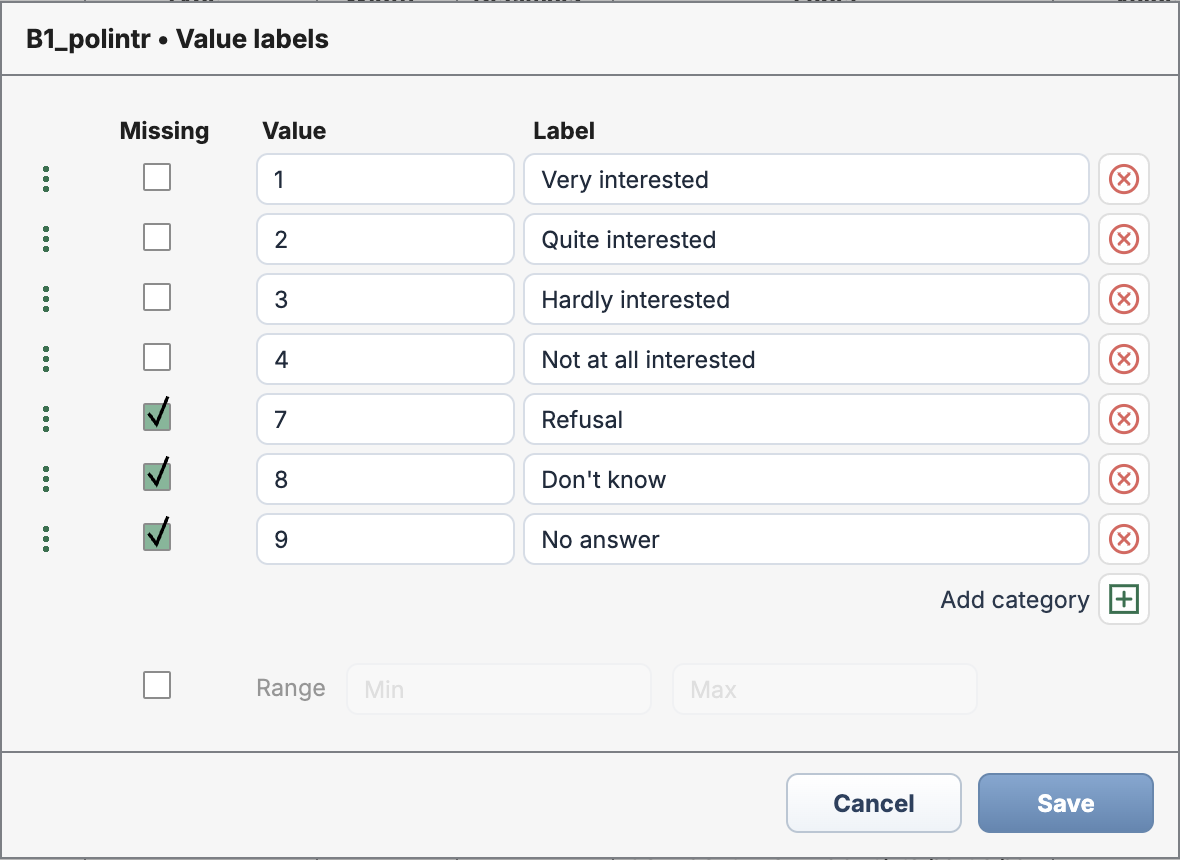
Choose how you work
DialogR is a graphical layer on top of R. Install R first, then install DialogR for regular analysis on your computer.
You are responsible for installing R and the necessary R packages. Installing DialogR alone does not complete desktop setup. The Packages menu helps you install and update the packages.
Desktop setup →Use R in your browser with the R runtime and packages needed by DialogR already included. No local R or package installation is needed.
WebR is slower than local R. It can use the same dataset; allow extra time for startup, imports, and analysis.
Open DialogR in the browser ↗One interface. Seven languages.
Use DialogR in English, German, Greek, Spanish, French, Polish, or Romanian.
Choose a language under Settings → General. Menus, editors, and every open dialog refresh immediately after you save — no restart required.
See how language switching works →Available now
The user manual
Follow actual screenshots of the data editor and each dialog, with numbered steps and explanations of the results. Learn with real ESS data and its declared missing values.